TURBO TEMPLATES
FOR UNIQUE ENHANCEMENTS
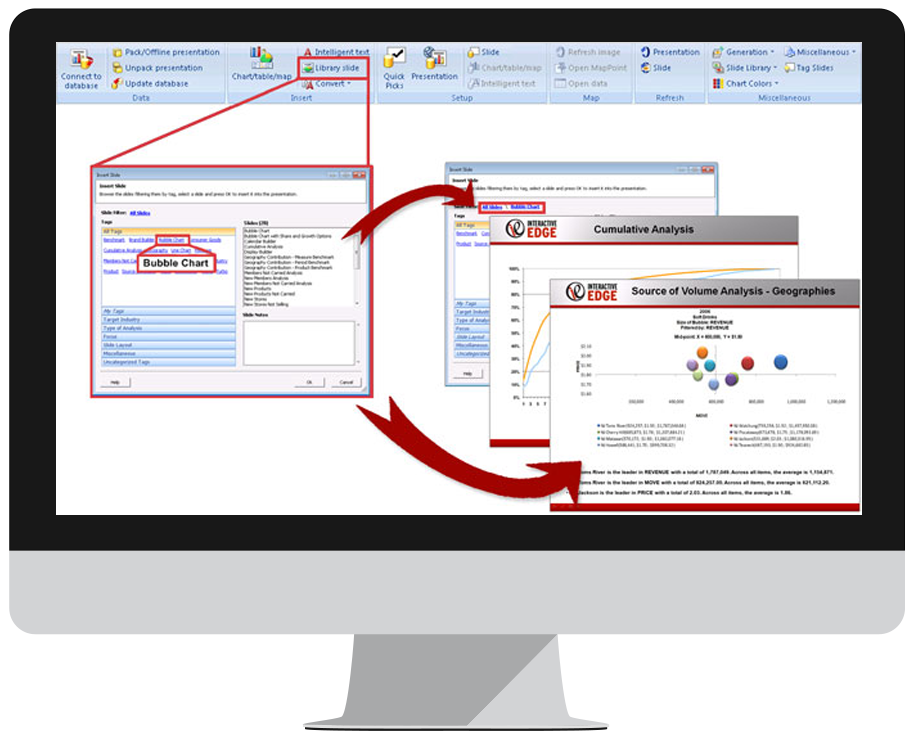
XP3 delivers Turbo Templates, a completely redesigned library system with enhancements that are unique in the business analytics industry. With an extensive system of analytical, flexible templates, you can:
- Quickly and easily uncover business information by choosing from a wide array of pre-built slides
- Populate slides with virtually ANY data, regardless of source or dimensionality
- Share templates between presentations that use different sources of data
- Select from a list of pre-built intelligent commentary with valuable insights from slide data or create your own
- Easily modify the pre-built report and save it as a new user-defined library slide which then can be shared
- with any other user
- Use the new Slide Library Manager to easily manage available slides with an interactive tagging system
STANDARD TEMPLATES
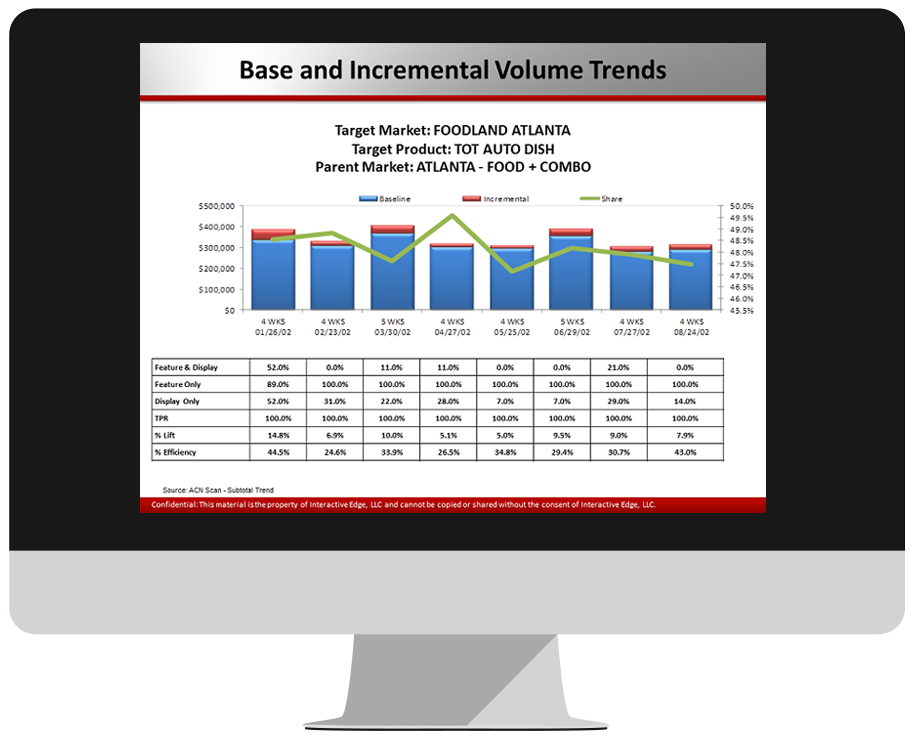
BASE & INCREMENTAL VOLUME TRENDS
This template provides an opportunity to review promotional performance by week or quad week to determine which promotions were effective in delivering incremental sales.
For each week, the base and incremental sales are shown in a stacked bar along with percent ACV support for each vehicle, lift, and efficiency measurements.
The chart also plots the share of parent market for the products to determine if the promotion resulted in the retailer capturing a larger share of the market sales.
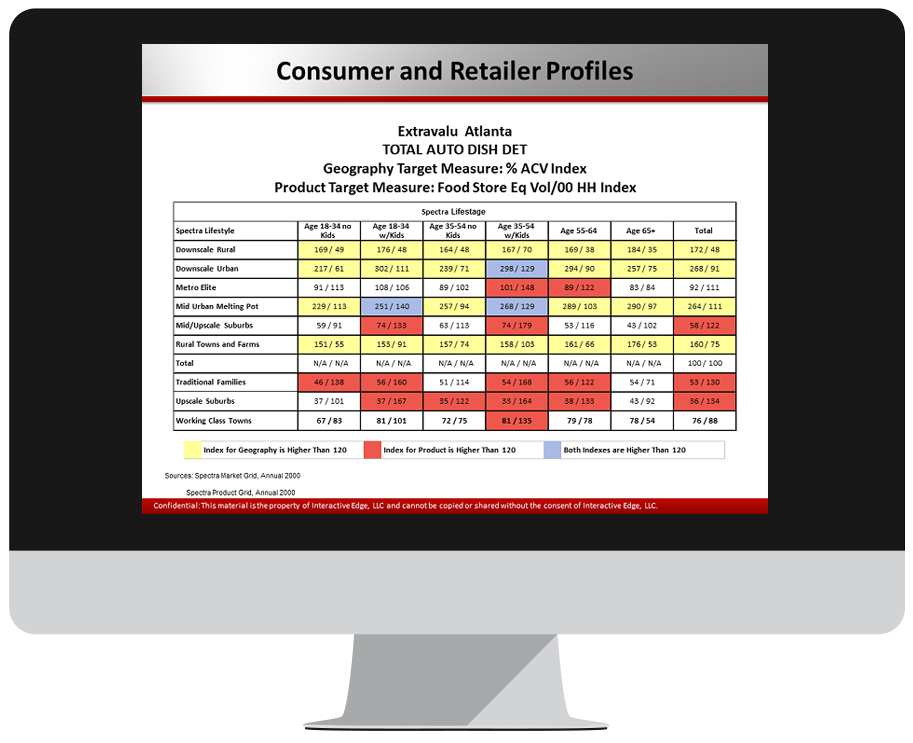
CONSUMER & RETAILER PROFILES
Consumer and shopper profiles are important to understanding the retailer’s customers and who purchases the products. Using Spectra Lifestyle and Lifestage data is one method for matching consumer profiles with product purchasers.
On this screen, consumer Lifestyles and LifeStages are compared for both the retailer shopper and the product shopper. Indices are calculated for each cell in the Lifestyle and Lifestage grid. Indices greater than 120 are highlighted.
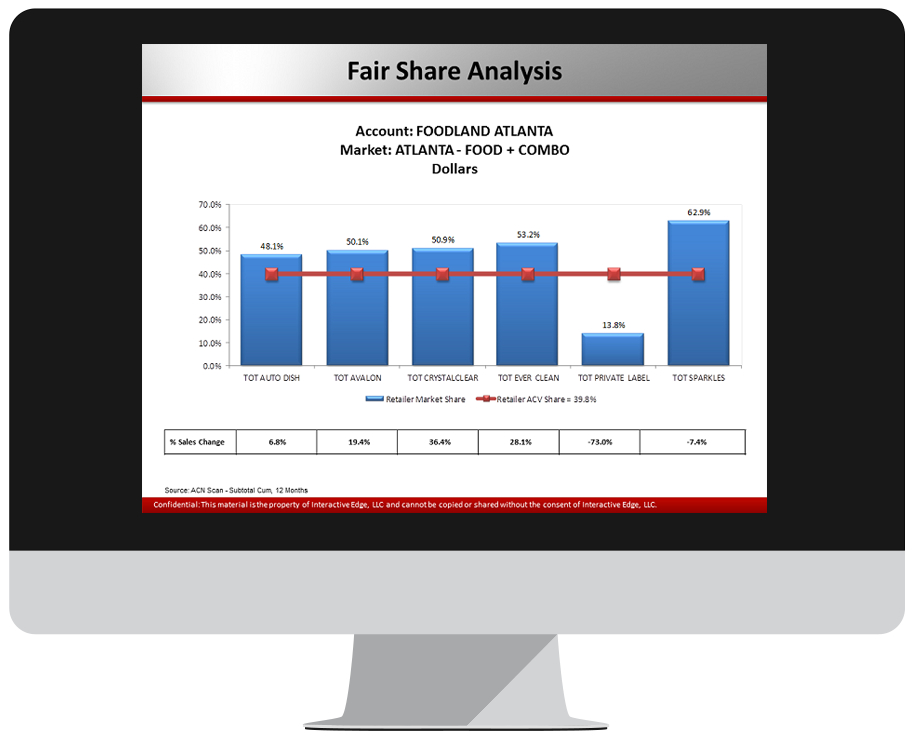
FAIR SHARE ANALYSIS
Display the percent of market sales for a selected retailer. Each bar on the graph represents one of the products selected. The category total and all category segments can be selected for display. The selected retailer’s percent of total ACV sales is shown as a horizontal line and reference point.
Bars that exceed the reference line have achieved a greater share than the fair share. In addition, a table shows the percent sales change for each product shown in the Fair Share chart.
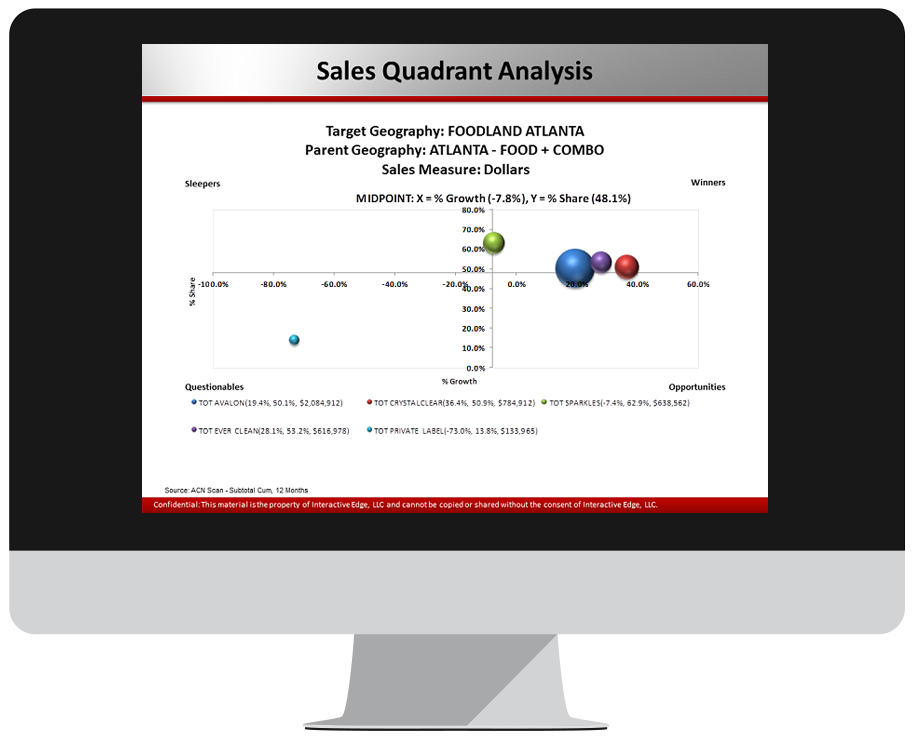
SALES QUADRANT ANALYSIS
The quadrant chart has become the standard for displaying the relative health of various products (category segments, category sub-segments) for a retailer. The use of three measures (percent growth of the product, percent share of parent market sales, and $ volume of the product) allows for the assignment of the product into one of three quadrants based on its performance.
Each quadrant is labeled with a general description of performance. The upper left quadrant is called the Sleepers quadrant, the upper right is the Winners quadrant, lower left is the Questionables, and the lower right is the Opportunities quadrant.
Each of these quadrants has manufacturer, retailer, and consumer implications and tactics to be employed.
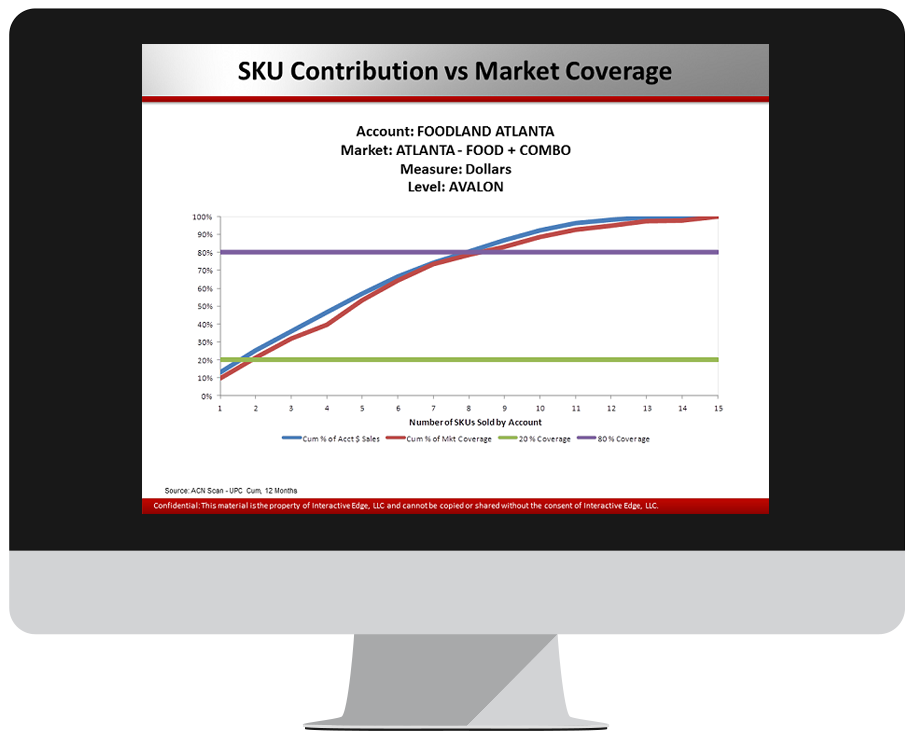
SKU CONTRIBUTION VS. MARKET COVERAGE
Visually display the cumulative SKU sales contribution relative to the cumulative market coverage for all SKUs stocked by the account. This template uses curves to show the cumulative percent sales contribution vs the cumulative % market coverage.
The user can also input minimum and maximum percent market coverage guidelines. It effectively allows the user to identify where there are assortment inefficiencies in specific categories or segments.
0 Comments